

Wie man ein Candlestick-Chart liest: Ein Leitfaden für Einsteiger
Was sind Candlesticks und wie entstehen sie?
Ein Candlestick stellt die Preisbewegung über einen bestimmten Zeitraum dar – das kann eine Minute, eine Stunde, ein Tag oder ein beliebiger anderer Zeitraum sein, den du in deinem Chart einstellst.
Jeder Candlestick erzählt die Geschichte von vier Kurswerten:
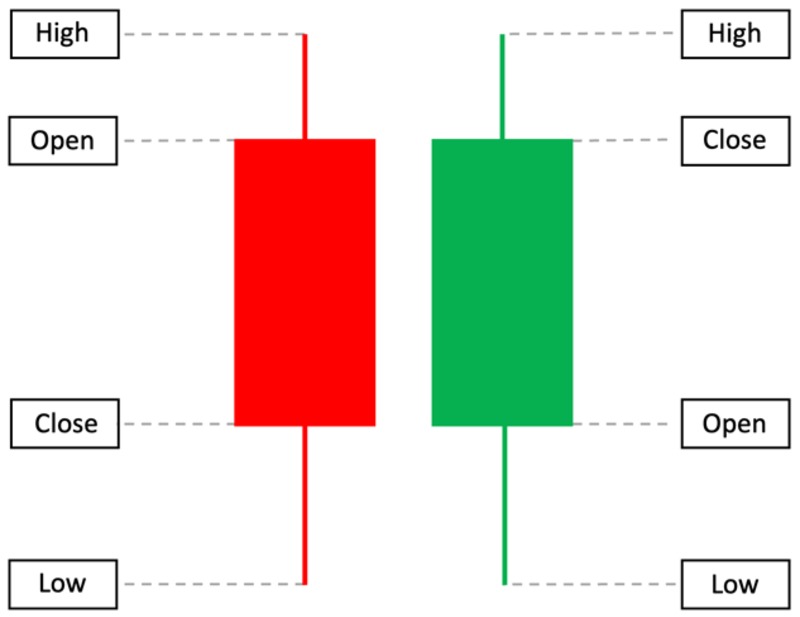
- Open – Der Kurs zu Beginn des Zeitraums
- Close – Der Kurs zum Ende des Zeitraums
- High – Der höchste Kurs während des Zeitraums
- Low – Der niedrigste Kurs während des Zeitraums
Candlesticks zeigen nicht nur, was der Kurs gemacht hat – sondern auch, wie sich der Markt in dieser Zeit gefühlt hat.
Aufbau eines Candlesticks: Körper und Dochte
Ein einzelner Candlestick besteht aus:
- Dem Körper – Das ist der dicke Teil der Kerze. Er zeigt die Spanne zwischen Eröffnungs- und Schlusskurs.
- Dem Docht (oder Schatten) – Das sind die dünnen Linien ober- und unterhalb des Körpers, die den höchsten und niedrigsten Kurs repräsentieren.
- Farbe – Die meisten Charts nutzen Grün (oder Weiß) für steigende Kerzen (Schlusskurs > Eröffnungskurs) und Rot (oder Schwarz) für fallende Kerzen (Schlusskurs < Eröffnungskurs).
Schneller Tipp:
- Langer Körper = starke Marktbewegung.
- Langer Docht = Markt testete Kursbereiche, drehte aber um.
- Kurzer Körper = Unentschlossenheit.
Grundlegende Candlestick-Muster, die jeder Anfänger kennen sollte
Hier sind einige einfache, aber kraftvolle Candlestick-Formationen, die in allen Finanzmärkten vorkommen:
1. Doji
Ein Doji entsteht, wenn Eröffnungs- und Schlusskurs nahezu gleich sind. Er signalisiert Marktunentschlossenheit.
📌 Bedeutung: Käufer und Verkäufer stehen sich gegenüber – kann auf eine mögliche Trendumkehr hinweisen.
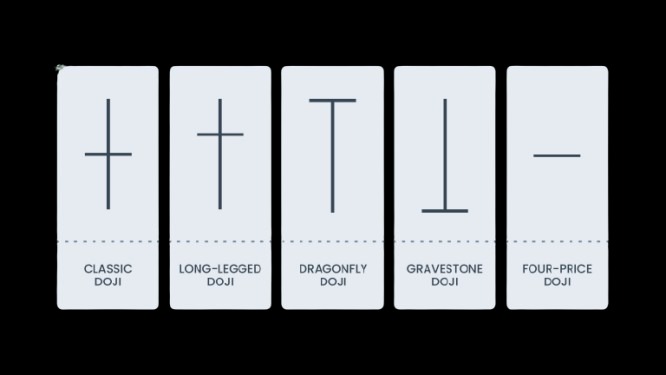
Arten von Doji-Kerzen und ihre Bedeutungen
Jede Variation eines Doji gibt unterschiedliche Hinweise, abhängig von der Position der Dochte und dem Trendkontext.
Standard-Doji (oder Neutral-Doji)
Optisch: Kleiner Körper mit etwa gleich langen oberen und unteren Dochten
Bedeutung: Reine Unentschlossenheit. Weder Bullen noch Bären haben Momentum.
Erscheinung: Häufig während Konsolidierungen oder vor wichtigen Nachrichten.
Langbeiniger Doji
Optisch: Kleiner oder kein Körper, mit langen oberen und unteren Dochten
Bedeutung: Starke Hin- und Her-Bewegungen; der Markt testete beide Richtungen.
Mögliches Signal: Volatilität und Unsicherheit, kann einem Ausbruch vorausgehen.
Pro-Tipp: Auf Bestätigung im nächsten Kerzenbild achten.
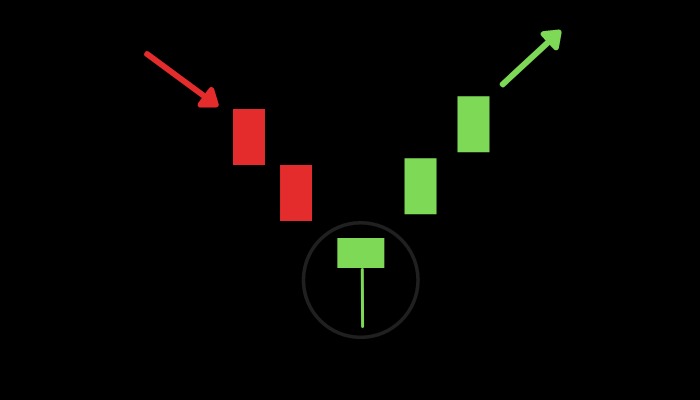
Libellen-Doji (Dragonfly Doji)
Optisch: Eröffnung, Schlusskurs und Hoch sind nahezu gleich; langer unterer Docht
Bedeutung: Der Kurs wurde stark nach unten gedrückt, Käufer trieben ihn aber zurück nach oben.
Signal: Bullische Trendumkehr, besonders nach einem Abwärtstrend
Beste Anwendung: In Kombination mit Unterstützungszonen oder Bestätigungskerzen.
Grabstein-Doji (Gravestone Doji)
Optisch: Eröffnung, Schlusskurs und Tief sind nahezu gleich; langer oberer Docht
Bedeutung: Käufer trieben den Kurs hoch, aber Verkäufer übernahmen vor Schluss.
Signal: Bärische Trendumkehr, besonders nach einem Aufwärtstrend
Häufig zu sehen bei: Widerstandsbereichen oder Hochpunkten eines Aufwärtstrends.
Vierpreis-Doji (selten)
Optisch: Keine Dochte – Eröffnung = Schluss = Hoch = Tief
Bedeutung: Absolute Unentschlossenheit, keine Volatilität
Nützlichkeit: Allein wenig aussagekräftig, aber bemerkenswert.
2. Hammer
Der Hammer hat einen kleinen Körper und einen langen unteren Docht. Er erscheint typischerweise nach einem Abwärtstrend.
📌 Bedeutung: Starke Ablehnung niedrigerer Kurse; kann eine bullische Trendumkehr signalisieren.
Hammer vs. Hanging Man
Der Hammer und der Hanging Man sehen fast identisch aus – aber ihr Kontext ist unterschiedlich:
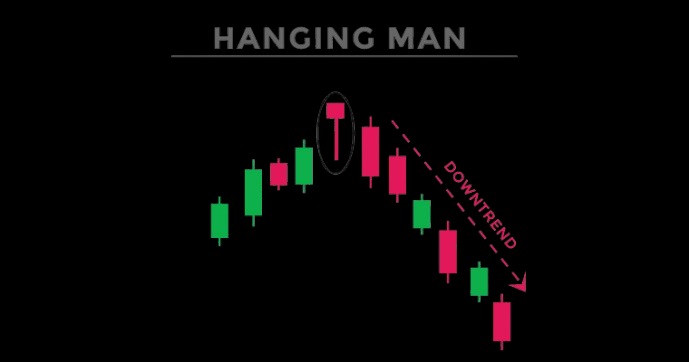
| Muster | Erscheint Nach | Mögliches Signal |
|---|---|---|
| Hammer | Abwärtstrend | Bullische Trendumkehr |
| Hanging Man | Aufwärtstrend | Bärische Trendumkehr |
3. Engulfing (Umkehrmuster)
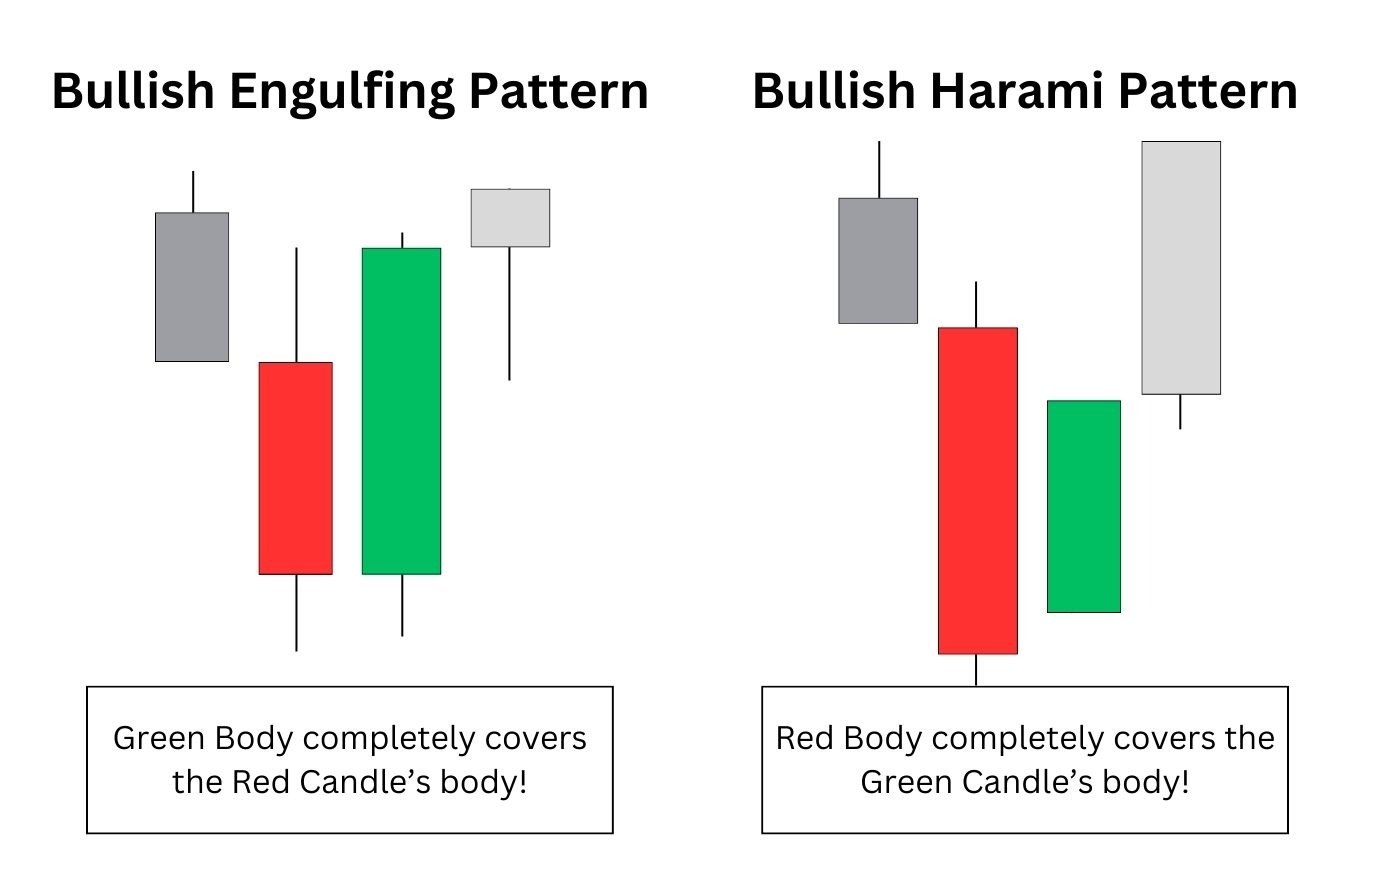
- Bullish Engulfing: Eine kleine rote Kerze, gefolgt von einer großen grünen Kerze, die die vorherige vollständig „verschlingt“.
- Bearish Engulfing: Das Gegenteil – eine bullische Kerze wird von einer größeren bärischen Kerze „verschlungen“.
📌 Bedeutung: Das Momentum ändert sich. Dieses Muster tritt häufig an Wendepunkten auf.
Bullische vs. Bärische Candlestick-Signale
Das Verständnis der Richtungs-Signale in Candlestick-Mustern kann dir einen entscheidenden Vorteil verschaffen.
| Typ | Visuelle Hinweise | Mögliche Bedeutung |
|---|---|---|
| Bullisch | Langer unterer Docht, grüner Körper, Hammer | Trendumkehr oder Fortsetzung nach oben |
| Bärisch | Langer oberer Docht, roter Körper, Shooting Star | Schwäche oder Abwärtsdruck |
| Neutral | Kleiner Körper, gleiche Dochte (Doji) | Unentschlossenheit oder Konsolidierung |
Profi-Tipp:
Lies Candlesticks immer im Kontext. Eine einzelne Kerze sagt oft wenig aus – Muster sind aussagekräftiger, wenn sie nahe Unterstützungs- oder Widerstandsniveaus oder innerhalb von Trends auftreten.
Warum Candlestick-Charts wichtig sind
Candlestick-Charts vereinfachen Kursdaten und zeigen die Emotionen hinter Marktbewegungen: Angst, Gier, Zögern, Überzeugung.
Egal ob du Forex, Aktien oder Kryptowährungen handelst – das Lesen von Candlesticks ist eine universelle Fähigkeit, die in allen Märkten funktioniert.