

Top 5 Trading Indicators Every Beginner Should Learn First
1. Moving Averages (MA)
What It Is:
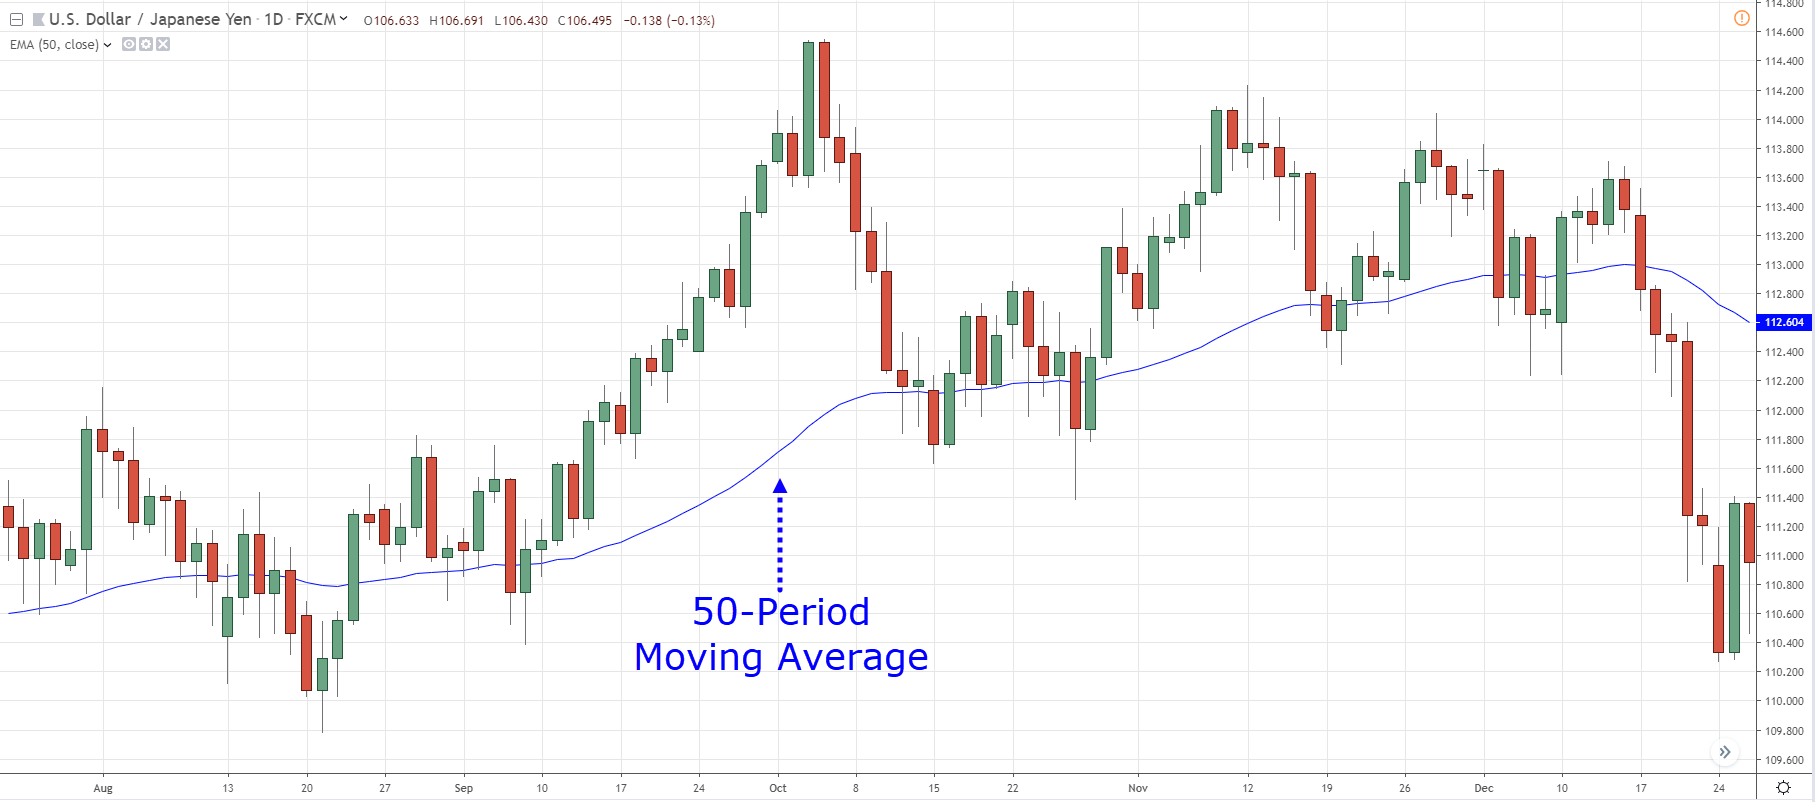
The Moving Average is one of the simplest and most effective indicators used by traders to smooth out price data over a specific time period. It helps identify the overall trend direction by filtering out the day-to-day price fluctuations.
Why It's Important for Beginners:
As a beginner, understanding the trend is crucial. Moving Averages show you whether the market is in an uptrend, downtrend, or sideways. This is essential because trading with the trend increases the probability of success.
How to Use It:
The most common types of Moving Averages are the Simple Moving Average (SMA) and Exponential Moving Average (EMA). The SMA averages out prices over a set number of periods, while the EMA gives more weight to recent prices. Beginners should start with a simple 50-period SMA to get a feel for the market's overall movement.
2. Relative Strength Index (RSI)
What It Is:
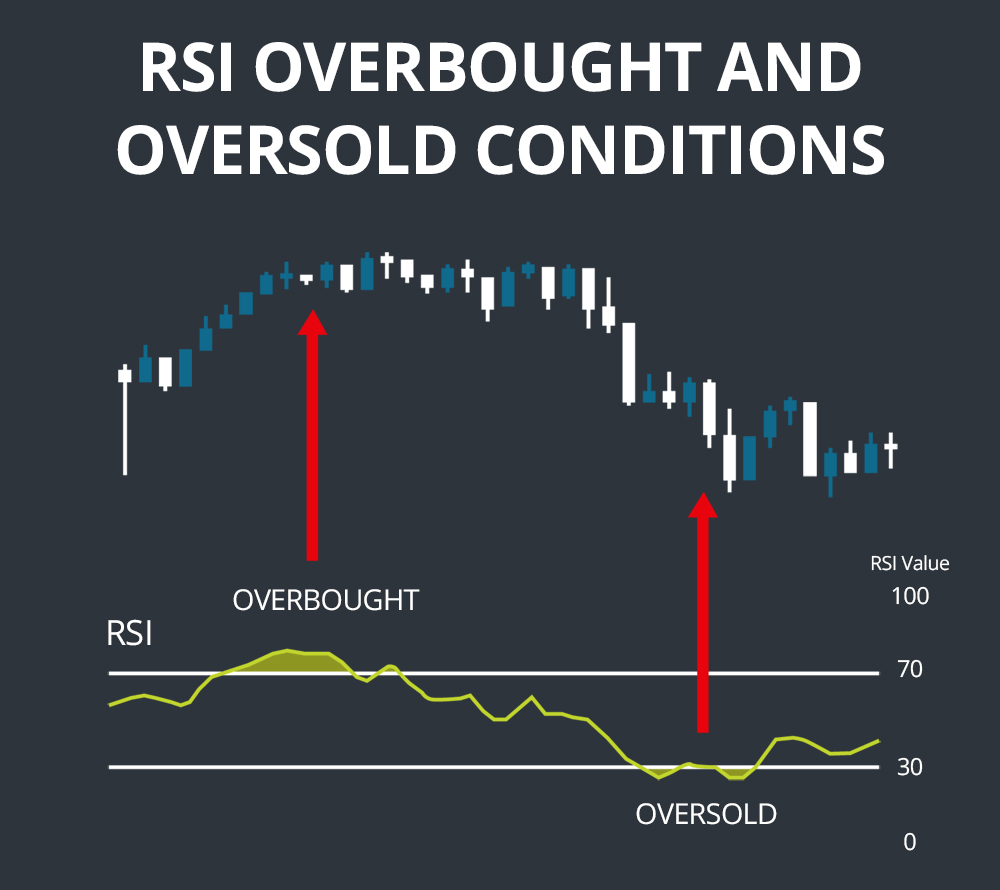
The RSI is a momentum oscillator that measures the speed and change of price movements. It indicates whether an asset is overbought or oversold, which can help predict price reversals.
Why It's Important for Beginners:
For beginners, the RSI is a fantastic tool to identify potential entry and exit points. When the RSI reaches overbought levels (above 70), it suggests that the asset might be due for a pullback. Conversely, when the RSI drops below 30, the asset could be oversold and may be ready for a bounce.
How to Use It:
You can use the RSI in combination with other indicators, like Moving Averages, to confirm signals. For instance, if the RSI shows an overbought condition and the price is also hitting resistance, it's a strong sign that a price reversal may be coming.
3. Bollinger Bands
What It Is:
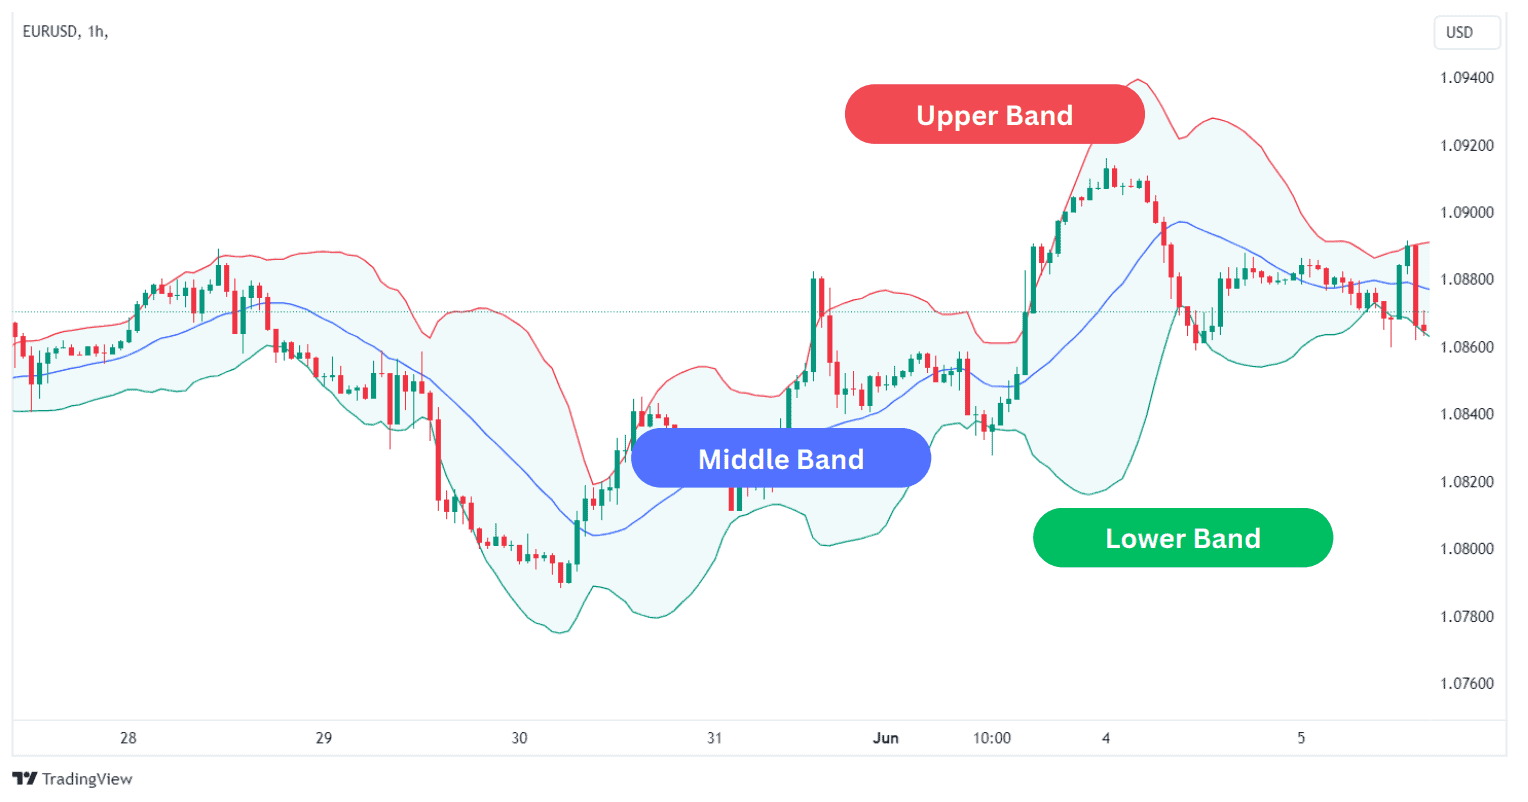
Bollinger Bands consist of a moving average (usually a 20-period SMA) and two standard deviation lines above and below the moving average. These bands expand and contract based on market volatility.
Why It's Important for Beginners:
Bollinger Bands help beginners gauge the volatility of an asset. When the price touches or exceeds the upper band, it may indicate that the asset is overbought, while touching or exceeding the lower band may signal an oversold condition. The bands can also show potential breakouts or consolidations.
How to Use It:
A useful strategy is to watch for price bounces from the lower or upper bands. If the price touches the lower band and starts to rise, it could be a buying signal. If it touches the upper band and starts to fall, it could be a selling signal.
4. MACD (Moving Average Convergence Divergence)
What It Is:
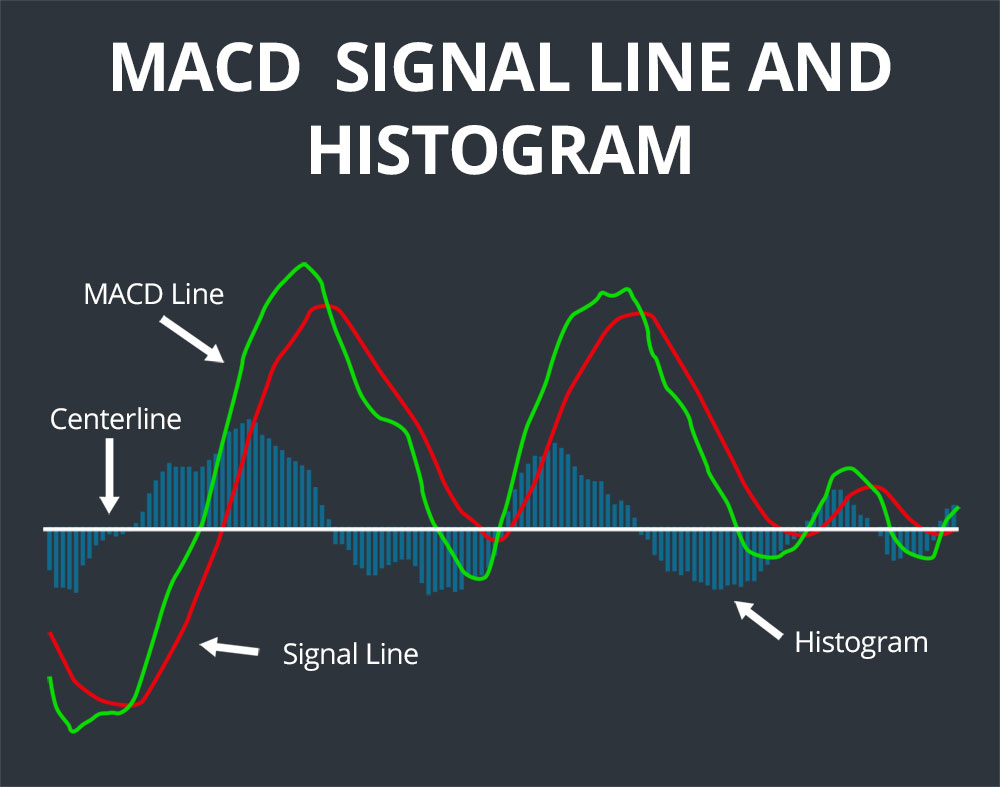
The MACD is a trend-following momentum indicator that shows the relationship between two moving averages of an asset's price. It consists of the MACD line, the signal line, and the histogram.
Why It's Important for Beginners:
The MACD helps beginners identify changes in the strength, direction, momentum, and duration of a trend. By learning to read the MACD, beginners can spot trend reversals or trend continuation, which is vital for making profitable trades.
How to Use It:
When the MACD line crosses above the signal line, it’s a bullish signal (buy). When the MACD line crosses below the signal line, it’s a bearish signal (sell). The histogram represents the difference between the MACD and signal line and is useful for identifying the momentum of the move.
5. Volume
What It Is:
Volume measures how much of an asset is traded during a specific time period. It's an important indicator because it shows the strength of a price movement.
Why It's Important for Beginners:
Volume is a key confirmation tool for beginners. Price movements accompanied by high volume are often more reliable than those with low volume. If you see a strong price move but low volume, it might indicate a false breakout or a weak trend.
How to Use It:
Look for volume spikes during price breakouts or reversals. For example, if the price breaks above resistance with high volume, it may indicate a strong trend continuation. Conversely, low volume during an uptrend or downtrend may signal a potential reversal.
Conclusion:
Mastering these five trading indicators—Moving Averages, RSI, Bollinger Bands, MACD, and Volume—will give you a solid foundation in technical analysis. As you progress in your trading journey, you can start exploring more advanced indicators, but for now, these five will provide you with the essential insights you need to make better decisions.
Remember, no indicator is perfect on its own. Combine them with other tools, stay disciplined, and practice regularly. The more you learn and understand, the more confident you'll become as a trader.
Good luck, and happy trading!